In my previous blog post I set up an experiment to figure out what is the fastest setup for SQL Server and SSIS to extract and load a file into a table. In this post I will be discussing the results of this experiment.
The experiment
The experiment considered a simple two step ELT process:
- A big file is extracted into a staging table
- The staging table is loaded into a datastore table using an insert statement
The different variables that were tested:
- Tables in same file or different filegroup
- If tables in different filegroup would it matter to split the filegroups up in multiple files
- Use of balanced data distributor to get parallel insert in the extraction phase
- Number of destinations for balanced data distributor
- Dataflow buffersize
Total performance
Taking the best performing scenario it looks like we can extract and load a file in 10 + 45 seconds. This makes a total of 55 seconds. This is about 5 times as fast as we thought we could do it. The optimal settings are as follows:
- Buffersize: 100.000
- Staging table divided over 8 files
- Datastore table in a single file
- 8 Balanced data distributors
However if we want to make our life simpler, and not split up our database in so many files, what performance may we reach then? Answer: Also 55 seconds. Even though when we look at individual parts of the process that may benefit from multiple files, overall the difference is so small you would have to have a very very specific need or hardware setup in order to achieve higher performance by splitting up your database and tables.
Extraction performance
The graph below shows throughput time on the Y-axis and buffer size on the X-axis. The different lines represent the different scenarios in which balanced data distributor and number of files were tested with different settings.
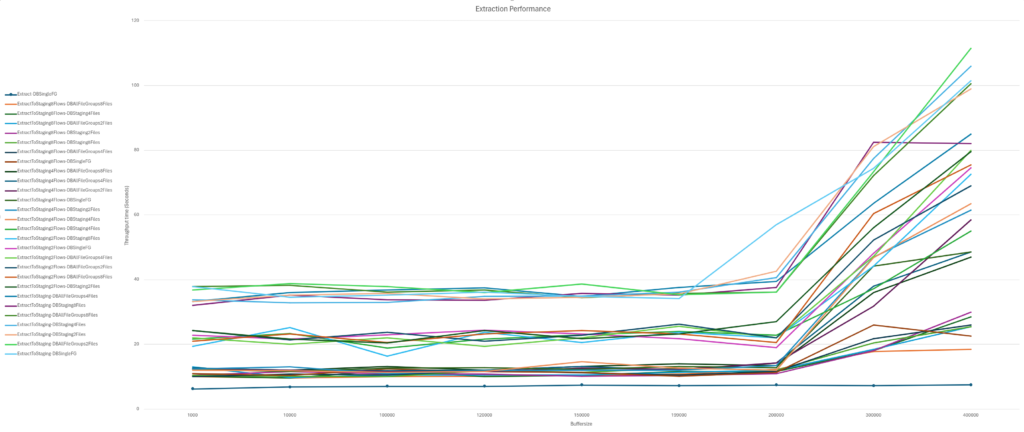
First by looking at the buffer size we can conclude there is an upper bound beyond which performance degrades amongst all scenarios. For this particular combination it seems to be around a buffer size of 200.000 rows.
If we exclude all observations that were obtained with a buffer size of more than 200.000 the scenarios cluster together into roughly three groups:
- The slowest was the extraction package without any balanced data distributor
- The middle group was the package in which 2 balanced data distributors were used
- The fastest was the group in which the extraction was done with 4 and 8 balanced data distributors with 8 being marginally faster than 4
- With 4 balanced data distributors the write speed almost reached the maximum read speed. Adding more write capacity won’t affect performance that much as read speed becomes the bottleneck.
Loading performance
Since this process runs in the database engine the SSIS package variants are left out. This is why not the same amount of scenarios are shown.
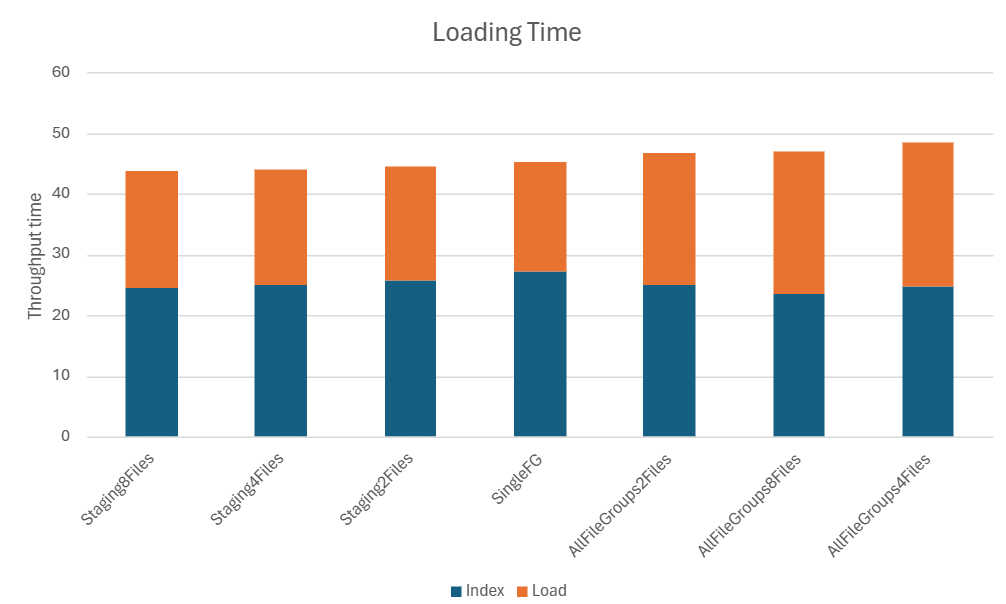
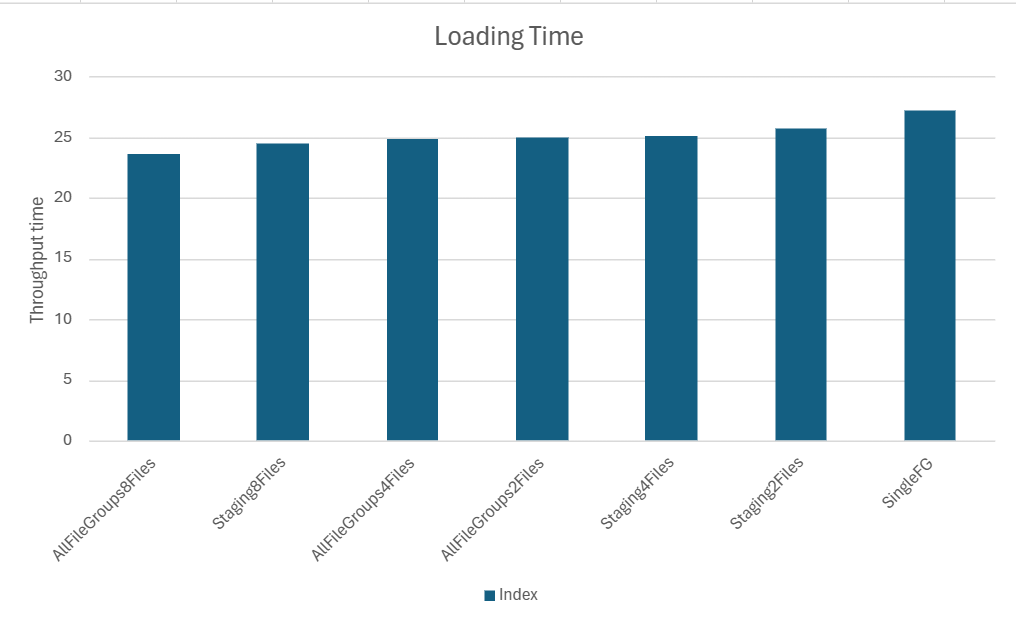
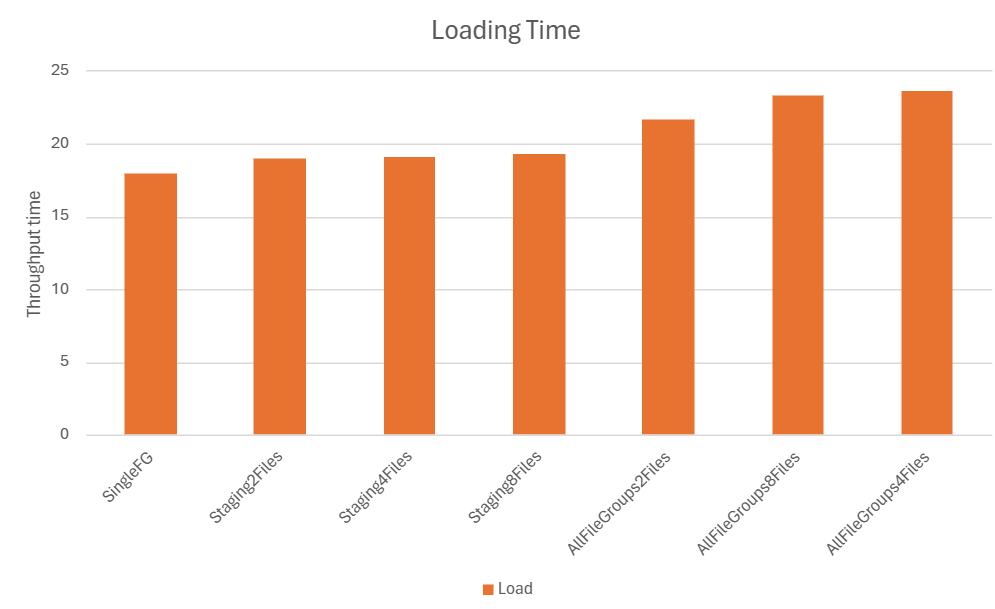
It looks like the creation of the index is fastest when the filegroup in which the source table sits is split up over multiple files. Once you have the index however, loading is fastest when the filegroup consists of a single file only. Splitting up the filegroup in which the target table sits only slows the process down. Total loading performance is best when the source table and index sit in a filegroup distributed over multiple files and the target table sits in a single file.
Remarks
In the previous post the extraction without insert into table took 10 seconds. When running the experiment multiple times this averaged to 7 seconds.
The results obtained here largely depend on the file and the hardware. It would be good to experiment with the different variables yourself.
I’m pretty sure results will be different based on number of columns, data types of those columns and other variables I have not even begun to consider.
Looking at the loading performance versus the extraction performance I am fairly confident I have made some stupid choices in the loading design. Luckily for all of us some clever people over at Microsoft wrote a technical article called The Data Loading Performance Guide. I will be diving into that one and write another post with improvements to my own setup.
Performance monitor
In the previous blog post I promised to put a performance monitor graph up here. In the below graph I put coloured bars on the X axis to indicate the different steps in the process:
- Green: Extract
- Orange: Build index
- Red: Load table
Interestingly in the loading step, the writing speed is quite low initially and only goes up approximately halfway. My initial idea was to run that query with live statistics to see what is going on. However, even before running it I could already see the problem. I had accidentally left an Update Statistics in there. This takes about 24 seconds.
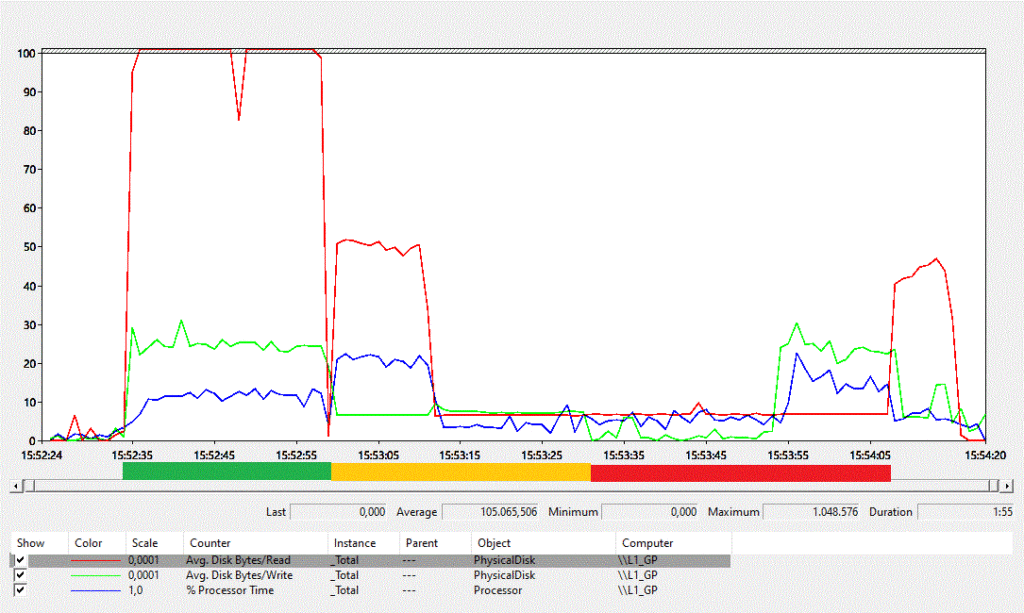
Since prior to the load step, the index on the source table is freshly created, there is no need to run this once more. It is therefore a useless step that can be removed. Together with other improvements this will yield another blog post!